

Cover image source: AI-generated conceptual editorial illustration; not a verified OASYS model, facility or test. Technical figures are separately attributed.
The cost after purchase
Compare equivalent chair programs through a stated cost boundary and time horizon. Separate quotation inputs, observed operating records and assumptions before interpreting a lower total.
| Hypothetical 100-chair program | A: USD | B: USD |
|---|---|---|
| Acquisition | 30,000 | 35,000 |
| Delivery | 2,000 | 2,000 |
| Assembly and setup | 1,500 | 1,000 |
| Initial service stock | 1,000 | 1,200 |
| Service expenditure | 6,000 | 3,000 |
| Complete replacements | 5,000 | 2,000 |
| End of use | 800 | 600 |
| Residual value deduction | 0 | −1,000 |
| Nominal five-year scenario total | 46,300 | 43,800 |
Define the decision and cost boundary
State what is being compared. The buyer may be selecting a corporate chair standard, choosing an OEM platform, or evaluating a service arrangement. Identify the configurations, quantity, application, sites, delivery route, and time horizon. The model should describe one coherent decision rather than combine costs from unrelated programs.
Define included and excluded items. Acquisition, freight, installation, setup, service parts, labor, replacements, and end of use may each be relevant. The boundary should be the same for every proposal. If one supplier includes installation and another does not, normalize the difference before comparing totals.
Record why an item is excluded. A cost may be genuinely identical across options or outside the decision scope. It may also be unknown. Those are different reasons and should not be confused. An unknown consequential cost should remain visible as an uncertainty rather than disappear from the calculation.
Keep the model proportionate. A simple purchase may need a short scenario comparison, while a large multisite program may need more detail. The objective is to understand the factors that can change the decision. A complicated spreadsheet is not automatically more reliable than a concise model with clear inputs.
Confirm equivalent requirements first
Compare configurations and mandatory conditions before cost. Identify actual components, materials, functions, evidence, packaging, and service scope. A cheaper chair that omits a required feature is another proposal, not an equivalent lower cost version. The buyer should decide whether that difference is acceptable through the specification process.
Use a deviation schedule to normalize offers. Ask suppliers to identify included options, exclusions, assumptions, and pending requirements. Resolve the important differences or model them transparently. Do not force identical manufacturing approaches, but ensure the comparison addresses the same required outcome.
Keep evidence review independent from the arithmetic. A low scenario total cannot establish product suitability or report applicability. Qualified personnel should close technical conditions. The cost model then helps compare commercially feasible options under the agreed requirement set.
Record the configuration release used by the model. If the chair changes, update relevant costs and evidence decisions. A model based on an earlier version can remain mathematically correct while no longer describing the proposal. Version control applies to commercial analysis as well as drawings.
Separate known inputs from forecasts
Known inputs may include a current quotation, delivery charge, assembly proposal, or agreed parts price. Forecasts may include service events, replacement quantities, internal labor, and residual value. Label them separately. The reader should understand which numbers are supported by a proposal and which depend on assumptions.
Record the source, date, units, and scope of each input. A unit parts price should not be used as a complete service event cost if labor and transport are separate. A forecast quantity should identify the time period and population. Consistent input definitions prevent hidden calculation errors.
Use ranges where uncertainty matters. A single expected service cost can conceal a wide range of plausible outcomes. The buyer may compare a base scenario with alternative assumptions. This is a planning method, not a prediction that the selected scenario will occur.
Avoid invented empirical rates. If the organization lacks reliable records, state that limitation and use explicitly hypothetical scenarios. Do not describe a supplier as having fewer failures because its chair costs more or has another material. Product and service data should support any factual comparative claim.
Model acquisition and delivery correctly
- Calculate chair quantity multiplied by the quoted configuration price, then add the relevant separate items.
- Confirm the delivery basis.
- Review packaging and shipment assumptions.
Identify currency, quotation validity, quantity assumptions, and any development or tooling charges. If charges are shared across a program, state how they are allocated. The method should match the commercial decision.
ICC describes Incoterms 2020 as allocating specified obligations, costs, and risks (International Chamber of Commerce, n.d.). A purchasing model should use the actual agreed rule, named place, and remaining terms. Do not add a freight item already included or omit one because the unit price appears comprehensive.
Knocked down and assembled configurations may create different handling and installation needs. Use current carton and logistics information for the proposed version. A catalog container quantity is not a complete landed cost model.
Separate destination charges and other obligations through the organization’s qualified commercial process. This paper does not provide current tariffs or tax advice. Use project specific verified inputs where those costs matter. The model should show its scope and avoid presenting an incomplete figure as final landed cost.
Include assembly and setup scope
Ask who performs assembly, receives goods, handles packaging, and checks completeness. Include the actual proposed costs or internal labor assumptions. A supplier’s lower unit price may reflect another delivery state. The buyer should compare the complete process that produces a usable installed chair.
Include setup support where relevant. CCOHS’s furniture purchasing guidance addresses trial and user setup considerations (Canadian Centre for Occupational Health and Safety, 2026). For the model, identify the organization’s proposed implementation effort rather than assign an unsupported universal training cost. The support plan should match the chair and workplace.
Distinguish one time implementation from recurring onboarding. A corporate program may need guidance for new users after launch. A retail program may need customer support content and remote assistance. Record those obligations if they differ among options and are material to the decision.
Avoid claiming measured productivity benefits from setup without suitable evidence. The cost model can include actual labor needed to install and support the product. It should not invent a financial return from a health or performance outcome the project did not study.
Define a service event cost
A service event may include assessment, part, labor, transport, temporary replacement, and administration. Identify which items belong in the model and whether they are cash or internal resource estimates. A low part price does not establish a low event cost. The service route should come from the actual supplier arrangement.
Ask for compatible parts, instructions, warranty process, and ordering terms. The model should reflect what the buyer can actually obtain and do. If a repair requires replacing a larger assembly, use that approved service unit. Do not assume an improvised component repair is available.
Keep event frequency separate from event cost. Frequency is an assumption or measured input; cost is another input. This separation makes sensitivity analysis useful. The buyer can identify whether uncertainty about quantity or the service arrangement drives the comparison.
Review technical suitability before choosing a repair route. A cheaper action should not preserve an unresolved structural or functional concern. Qualified personnel should determine the appropriate service. Commercial analysis follows that decision rather than replace it.
Model replacements and end of use
Identify which replacements are included and why. A forecast may relate to damage, organizational changes, loss, or another assumption. Do not describe every replacement as a product failure unless records support that classification. The model should preserve the reason and uncertainty.
Avoid double counting repairs and replacements for the same assumed event. If one scenario uses a part repair and another uses a complete chair replacement, model the alternatives clearly. A service budget and a replacement budget can overlap if their definitions are vague. Review the logic before comparing totals.
Include end of use transport, reuse, disposal, or other arrangements relevant to the organization. Use actual proposals or explicit assumptions. Residual value should be supported or identified as uncertain. Do not assume every chair has a resale market or that a recyclable material creates a cash return.
Keep environmental measures separate from financial cost unless an explicit justified valuation is used. A cost model can record a repair or reuse route without proving lower environmental impact. If such a claim is made, it needs its own defined comparison and evidence.
Describe a threshold without inventing a failure forecast
A break-even event count is a question for evidence collection. It does not prove that a more expensive chair prevents service visits. Ask which records could support a frequency assumption: comparable internal fleets, a relevant trial or a supplier’s clearly scoped service history. If the evidence does not exist, retain a scenario range and show where the preference changes.
Keep cost treatment consistent. If an internal service hour is included as a resource estimate, do not automatically add another full outsourced invoice for the same work. If a replacement already includes the approved part and labor, remove overlapping repair costs for that event. The practical value of the model comes from making these boundaries inspectable. A price premium can then be assessed against the obligations the buyer will actually support.
Use a transparent hypothetical example
Consider one hundred chairs over an illustrative five year period. Program A has a hypothetical unit price of three hundred dollars; Program B has a hypothetical unit price of three hundred fifty dollars. Acquisition is therefore thirty thousand dollars for A and thirty five thousand dollars for B. The figures are invented and do not represent supplier quotations.
Assume delivery costs two thousand dollars for each program. Assembly and setup are assumed at one thousand five hundred dollars for A and one thousand dollars for B. Initial service stock is assumed at one thousand dollars for A and one thousand two hundred dollars for B. These are scenario inputs, not claims that either product type normally requires those amounts.
Assume total service expenditure over the period is six thousand dollars for A and three thousand dollars for B. Complete replacements are assumed at five thousand dollars for A and two thousand dollars for B. End of use expenditure is assumed at eight hundred dollars for A and six hundred dollars for B. The model assumes these categories do not overlap.
Finally, assume no residual value for A and one thousand dollars for B. No discounting, inflation, tax, or exchange rate change is applied in this simple example. The model is a nominal scenario comparison. Its purpose is to show how a transparent boundary can produce a different result from acquisition price alone.
Calculate and interpret the example
For A, add thirty thousand, two thousand, one thousand five hundred, one thousand, six thousand, five thousand, and eight hundred dollars. The scenario total is forty six thousand three hundred dollars. For B, add thirty five thousand, two thousand, one thousand, one thousand two hundred, three thousand, two thousand, and six hundred dollars, then subtract one thousand dollars. The scenario total is forty three thousand eight hundred dollars.
Dividing by the initial one hundred chairs gives four hundred sixty three dollars per initially purchased chair for A and four hundred thirty eight dollars for B. Under these invented assumptions, B has a lower scenario total by two thousand five hundred dollars. That is the arithmetic result of the inputs, not a measured saving or a forecast for another program.
The denominator matters. Cost per initially purchased chair is not the same as cost per occupied workstation year or per usable chair year. The example does not calculate those measures because it does not model occupancy or time out of service. A buyer should choose a denominator appropriate to its question and define it clearly.
The result also depends strongly on forecast costs and residual value. If those assumptions change, the preferred option can change. The buyer should not use this example to conclude that a higher acquisition price usually produces a lower total. It demonstrates a method for identifying the conditions under which that conclusion holds.
Test the assumptions that drive the result
In the example, B begins with a five thousand dollar acquisition premium. The model then assigns lower service and replacement costs and a residual value that more than offset it. Those inputs deserve review. If the buyer has no evidence supporting the differences, they should remain hypothetical scenarios rather than a base forecast presented with false confidence.
Create alternative scenarios by changing one driver at a time where useful. Equal service costs, no residual value, or another replacement assumption can show how the result responds. Keep the boundary and other inputs consistent. The purpose is to understand sensitivity, not generate a favorable outcome for the preferred supplier.
Ask what evidence would reduce uncertainty. Reliable fleet records, service quotations, parts availability, and actual installation plans may improve inputs. The buyer should prioritize the information that can change the decision materially. Collecting minor cost details while ignoring uncertain service assumptions can create an illusion of precision.
Document the decision despite uncertainty. A buyer may choose an option for another justified reason, such as fit or operational compatibility. The model should show its role and limits. Commercial analysis should clarify tradeoffs rather than pretend every purchasing judgment can be reduced to one exact number.
Compare time horizons and financial methods carefully
Use the same horizon across proposals. A model comparing one chair over three years with another over seven years is not automatically meaningful. Identify why the horizon fits the organization’s planning decision. Do not assume a laboratory cycle result or warranty duration establishes the correct ownership period.
For longer or more consequential programs, finance personnel may require discounting or another method. Use the organization’s approved assumptions and treat timing consistently. This paper does not recommend a universal discount rate. The simple worked example intentionally avoids those additional calculations.
If costs occur in different years, retain their timing in the detailed model. A service cost at launch and a cost near the end can have different treatment under an approved financial method. Aggregating them into one line may be useful for a summary but should not conceal the underlying assumptions.
Keep currencies and price bases consistent. Exchange rates, inflation, and tax may matter to the actual project and require current verified inputs. Do not add them selectively to one option. The comparison should use a common method and show which facts can change over time.
Account for inventory and assortment complexity
Several chair configurations can create more stock items, parts, instructions, and purchasing decisions. Evaluate those obligations through the actual program. A standardized range may simplify some work, but this paper does not guarantee a saving from standardization. The model should show the costs it includes and the evidence or assumptions supporting them.
Consider material and component purchasing constraints. A special option may require stock that exceeds the opening order. Ask how the supplier proposes to manage it and who bears the cost. The unit chair quotation may not reveal that commitment. Include relevant obligations transparently.
Review complete spares versus parts stock. A fleet without local service capability may need another arrangement from a fleet with trained technicians. Compare response requirements, storage, lead time, and actual compatibility. Do not use a universal spare percentage unrelated to the program.
Keep accommodation options in scope. A general corporate chair standard may still require alternatives. Model the practical route where it materially differs among proposals. Cost should not justify removing individual assessment or mandatory requirements from the program.
Use actual operating data responsibly
When the organization has service records, review their definitions and completeness before using them. Distinguish product faults, damage, setup questions, and replacements for organizational reasons. A combined count may not support a claim about failure rate. Data quality matters to the model’s meaning.
Check the population and period. A service count without the number of chairs and exposure period cannot be compared directly with another fleet. Record configuration differences and support arrangements. The buyer should not attribute every difference to the chair design without appropriate analysis.
Use data within its limits. Historical experience can inform scenarios, but another site, configuration, or user pattern may differ. State assumptions when transferring an input. Avoid presenting a forecast as though it were an observed outcome.
Feed findings into procurement. Reliable records can reveal whether parts access, instructions, or another process drives expenditure. Qualified teams should investigate causes and actions. The model should help improve the program rather than simply rank suppliers through an unexplained total.
Choose a denominator that matches the question
Cost per chair purchased is useful for some sourcing comparisons, but it can conceal differences in service continuity. If the organization wants a cost per usable workstation year, it must define how availability and time are measured. A model cannot claim that measure simply by dividing a five year total by five without checking whether the initial fleet remained available throughout the period.
For a hypothetical example, one hundred chairs planned for five years represent five hundred planned chair years before considering additions, removals, or time out of service. That is a planning denominator, not a measured usable exposure. If the buyer records actual availability, a different denominator may be appropriate. Keep those concepts separate so a simple arithmetic result does not imply operational evidence the model lacks.
Use the same definition across proposals. A comparison based on installed chairs for one program and purchased chairs for another can distort the result. The model should state quantity, period, and treatment of replacement or spare chairs. Finance and operating teams should agree on the measure before it is used in a decision summary.
Avoid double counting internal costs
Internal labor estimates can be useful, but their role should be clear. A service budget may already include labor that another line counts as administration or installation.
Review each category and identify overlap. Cash expenditure and allocated internal resource cost should remain distinguishable.
A transparent model can show both without implying that every estimated hour produces a separate invoice. This review helps prevent a detailed model from overstating cost merely because the same activity appears under several descriptive labels.
Communicate the decision clearly
Present the scope, mandatory requirement status, known costs, forecast assumptions, scenario totals, and main sensitivities. Explain what drives the preferred option and what could change it. A short clear summary supported by an inspectable model is more useful than a headline claiming that one chair saves money indefinitely.
Keep hypothetical examples labeled in public content. If OASYS uses a worked model for education, distinguish it from actual quotations and measured customer outcomes. Do not insert invented failure rates or savings percentages into a case study. A transparent example can be valuable without pretending to report empirical results.
For an OASYS inquiry, request configuration specific prices, delivery assumptions, assembly state, parts, warranty process, and support arrangements. Use those inputs with the buyer’s actual operating plan. Ask qualified reviewers to close technical and financial method questions.
Total cost of ownership becomes useful when it shows the complete commercial system and its uncertainties. The model should support a chair program the buyer can purchase, install, maintain, and explain. That is a stronger decision basis than acquisition price alone or an unsupported claim that premium features always pay for themselves.
Find the service threshold that can change the purchase decision
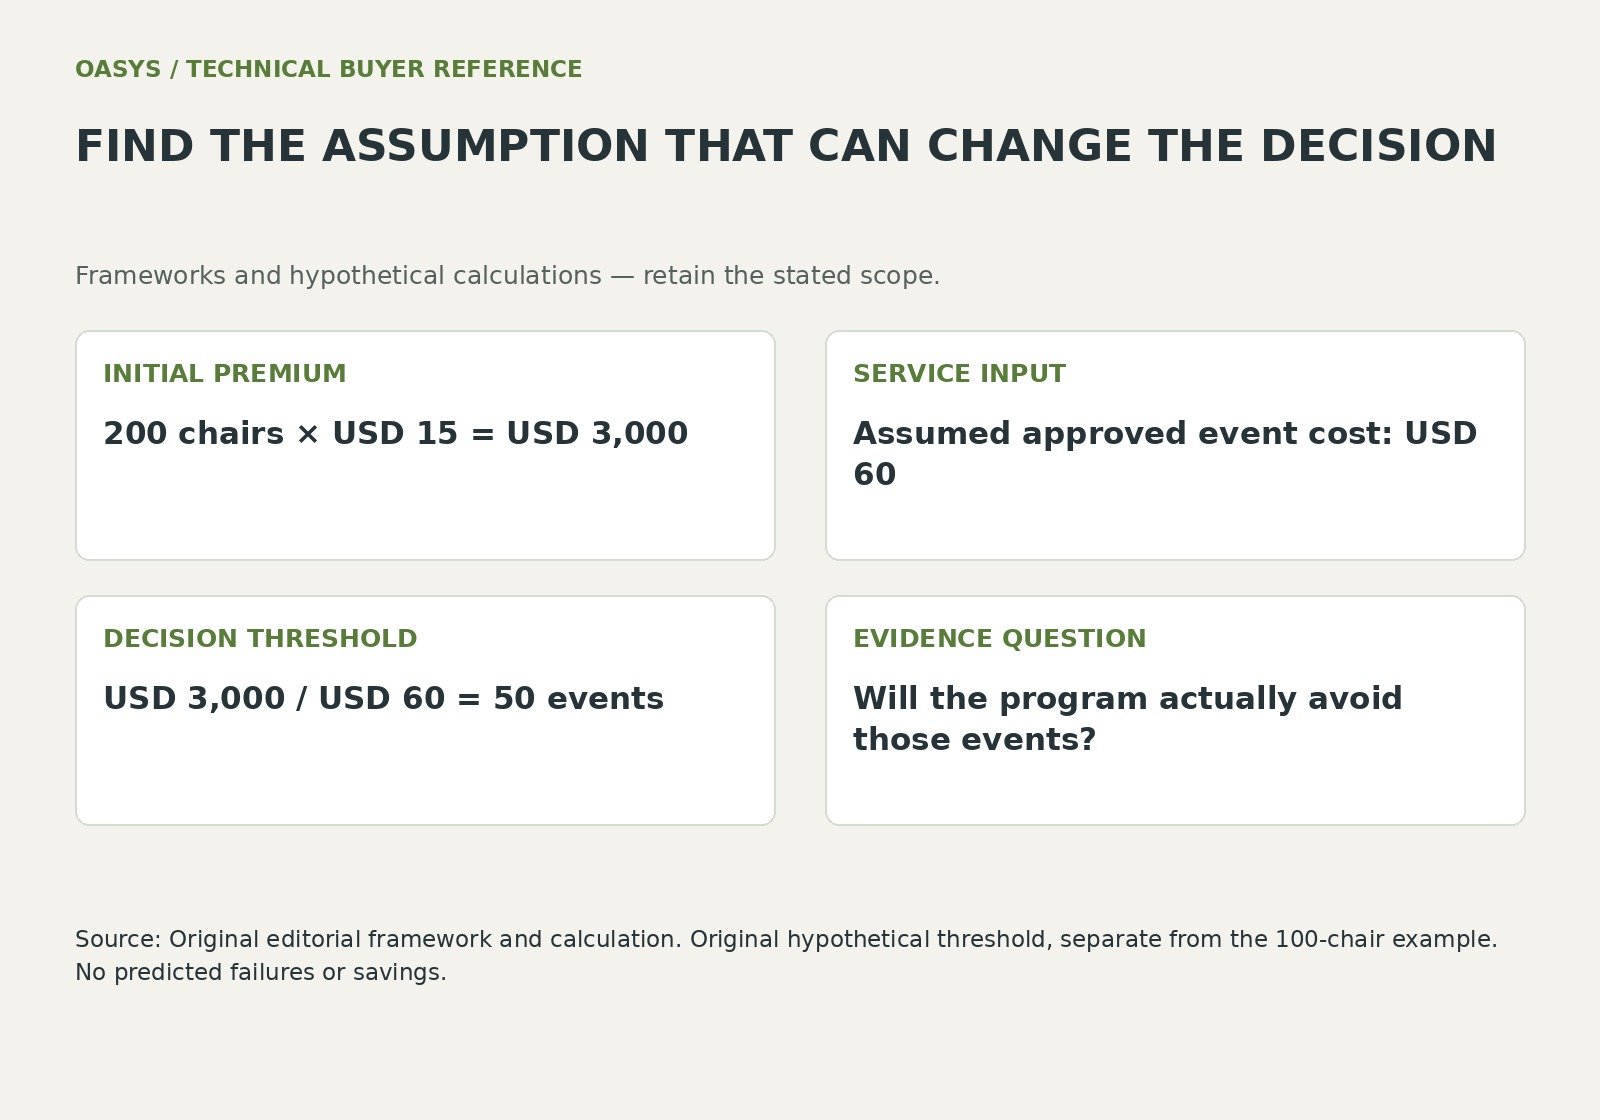
A cost model is most informative when it identifies a decision threshold. In a hypothetical 200 chair program, a configuration that costs USD 15 more per chair creates a USD 3,000 initial premium. If an approved service event costs USD 60 under the same cost boundary, fifty fewer events across the selected horizon would offset that premium. The arithmetic does not establish that the configuration will actually avoid those events.
Separate the questions of event frequency and event cost. Actual fleet records can support frequency estimates if product identities and observation periods are reliable. Supplier parts and labor proposals can support event cost. If either is unknown, show a range and determine whether the preferred choice changes within it. Avoid using a warranty term as a substitute for either input.
Packaging and installation also deserve their own cost bridge. A lower carton volume may reduce a shipping charge but increase destination assembly work. A replacement compatible with the approved version may protect remaining inventory, whereas an uncontrolled substitution can make the next event more expensive. Carry those dependencies into the model before calling a proposal lower cost over its life.
| Hypothetical threshold input | Value |
|---|---|
| Chairs | 200 |
| Initial premium USD per chair | 15 |
| Program premium USD | 3000 |
| Approved service event USD | 60 |
| Break even event difference | 50 over the defined horizon |
Discuss your office chair project with OASYS
Share your target market, application, proposed configuration, quantity and launch requirements with OASYS. A useful inquiry identifies which requirements are approved and which need engineering or commercial input.
Explore OEM and ODM services · Explore furniture resources · Contact OASYS
Close the approval record
- Confirm equivalent product and evidence requirements.
- Define costs, timing, exclusions and denominator.
- Separate recurring event cost from event frequency.
- Test consequential assumptions and retain the scenario version.
Questions buyers ask
Does a higher purchase price usually produce a lower ownership cost?
That conclusion depends on the defined inputs and evidence. The worked example is hypothetical. Test service, replacement, setup and residual assumptions rather than generalize its result to other chairs.
Should costs be divided by the initial chair count?
Use the denominator that answers the decision and identify it. Initial chair count, planned chair-years and actual usable exposure are different measures. Do not imply measured availability from a simple planning denominator.
Connect the review with your purchasing brief
Use Office Chair Price Comparison Retail Benchmarks and OEM Cost Drivers; Office Chair RFQ Checklist for Accurate OEM and ODM Quotations; Mesh vs Fabric vs PU Office Chairs Material Performance and Lifecycle Cost to connect this decision with the configuration and supplier review.
References
Canadian Centre for Occupational Health and Safety (2026, May 5). Office ergonomics: purchase of office furniture. https://www.ccohs.ca/oshanswers/ergonomics/office/purchase.html
International Chamber of Commerce (n.d.). Incoterms 2020. https://iccwbo.org/business-solutions/incoterms-rules/incoterms-2020/